
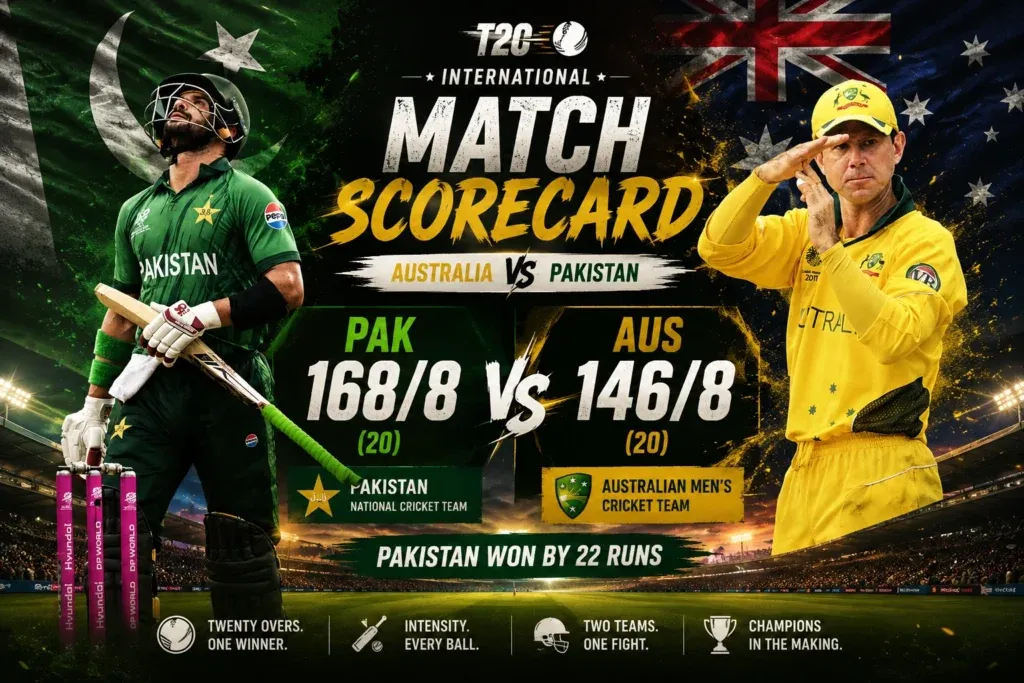
A cricket match leaves behind far more information than the final winning margin shown after play ends. cricketmatchteam.com can be useful for readers interested in cricket scorecards, player performances, team statistics, and useful match information presented without unnecessary confusion. A scorecard helps explain how the result developed from the first delivery until the last meaningful moment. It can show whether a team built a strong opening platform, recovered after losing early wickets, accelerated during the closing overs, or struggled to maintain momentum. Individual batting scores are only one part of this information because balls faced, strike rate, boundaries, dismissal method, and batting position can all change how a performance should be viewed. Bowling figures provide another perspective by showing overs, runs conceded, wickets, economy, and sometimes maidens as well. Partnerships reveal how players worked together, while extras explain runs that were not credited directly to batters. The fall of wickets can show exactly when an innings began to lose control or when the bowling side finally broke an important stand. All these sections create a much clearer picture than a final score alone. This is why scorecards remain useful for both casual followers and serious cricket fans who enjoy checking the details after every match.
Match Conditions Shape Numbers
Numbers on a cricket scorecard should never be judged without considering the conditions in which they were produced. The format is an obvious starting point because Test matches allow far more time than one-day or T20 games. A batter scoring at a modest pace can still have enormous value in Test cricket if they survive difficult bowling and protect the innings from another collapse. The same scoring rate might create serious pressure during a short T20 chase. Pitch conditions can also influence statistics because some surfaces make stroke-making easier while others reward accurate bowling and patient batting. Weather can affect movement through the air or off the pitch, although its influence varies according to the situation. Boundary size matters during limited-overs matches because shorter boundaries can encourage attacking shots and more frequent sixes. The stage of the innings is another important factor. Scoring quickly during the final five overs has a different meaning from scoring at the same pace during the opening phase. Readers who understand these conditions can interpret scorecard numbers with greater fairness. A statistic rarely exists on its own. The surrounding match environment helps explain why that statistic appeared in the first place.
Opening Partnerships Set Foundations
The first partnership of an innings can strongly influence everything that follows because a good start gives the rest of the batting order more freedom. Opening batters generally face the freshest bowling and may encounter movement that makes early scoring more difficult. If they survive those conditions and build a substantial partnership, the team can enter the middle overs with wickets in hand and a stronger platform. That situation allows later batters to attack with fewer concerns about another early collapse. A failed opening partnership creates a different challenge because new batters arrive earlier than expected. They may need to spend time rebuilding instead of immediately increasing the scoring rate. Scorecards make these changes visible through opening scores, individual runs, balls faced, and the fall of wickets. Partnership size is particularly useful because it shows how many runs were added before the first major break. A large opening stand can also affect bowling plans because captains may need to change bowlers or field settings earlier than planned. In a chase, a successful opening partnership can reduce the pressure on the required run rate and make the target look more manageable. This is why the first few batting numbers often provide important clues about the direction of the entire innings.
Middle Overs Create Balance
The middle overs often determine whether a team can maintain the platform created at the beginning or recover after losing early wickets. Batters need to rotate the strike, manage risk, and identify the right moments for attacking shots. Bowlers usually try to control the scoring rate during this stage by creating pressure through accurate lines, changing pace, and defensive field positions. Scorecards may show this phase indirectly through partnership figures, overs completed, runs scored, and wickets lost. A team can appear comfortable at the halfway point but still struggle to reach a strong final total if the scoring rate drops too much. Another side may recover from a difficult start by producing a steady middle-order partnership. This is where balls faced and strike rate become useful for understanding whether batters were keeping the innings moving. A batter does not need to hit boundaries every over to make an important contribution. Singles and doubles can maintain momentum while reducing the need for risky shots. Bowlers also gain value by creating quiet periods because pressure can force batters into mistakes later. The middle overs can therefore be viewed as a balancing phase where teams decide whether to preserve wickets, increase scoring, or prepare for a late acceleration. Scorecard details help reveal which approach worked better.
Finishing Overs Change Totals
The closing overs can change the appearance of a cricket scorecard very quickly because scoring often becomes more aggressive. Batters usually know how many deliveries remain and can calculate the value of taking greater risks. Boundaries become more important, while running between the wickets may also become faster because there is little time left. A team that reaches the final five overs with several wickets available can sometimes add a large number of runs. Another team arriving at the same stage after losing most of its middle order may have far fewer attacking options. Scorecards can show this difference through final totals, strike rates, boundary counts, and wickets remaining. Bowling figures also need context during this stage because final-over specialists face extremely aggressive batting. A bowler who concedes several runs can still make a valuable contribution by taking important wickets or preventing an even larger total. Fielding becomes especially important because every saved boundary can affect the final score. The finishing stage can therefore create significant changes without requiring a long period of play. For readers reviewing a match afterward, comparing the score before the final phase with the eventual total can reveal how effective the closing strategy was. This is one reason limited-overs scorecards can change dramatically during the final few overs.
Dismissals Tell Different Stories
The way a batter gets dismissed can add useful detail to the scorecard and sometimes reveal patterns within an innings. Catches can suggest that bowlers forced batters into attacking or mistimed shots, while bowled dismissals may indicate that the ball beat the batter completely. Leg before wicket dismissals involve specific conditions under cricket’s laws, while run-outs can result from risky running or fielding pressure. Stumpings can show how quickly a wicketkeeper reacted when a batter moved outside the crease. These methods should not be treated as simple indicators of batting quality because dismissal circumstances vary widely. However, patterns can become interesting when several wickets occur in similar ways. A cluster of catches behind the wicket might indicate movement or edges creating difficulty. Several run-outs can suggest communication problems or aggressive running between wickets. A sequence of wickets caused by a particular type of bowling may show that the opposition identified a useful weakness. Scorecards preserve these dismissal details so readers can examine how wickets were created rather than simply counting them. When combined with bowling figures and wicket timing, dismissal methods can provide a clearer view of how the bowling side gained control. This information becomes especially useful when reviewing collapses or sudden changes in an innings.
Bowling Spells Reveal Plans
A bowler’s complete figures can provide clues about how they were used by the captain during different stages of a match. Some bowlers are introduced early to attack the top order, while others are held back for the middle or final overs. Their numbers can look very different even when both players complete equally important roles. A powerplay bowler might aim for wickets while accepting some attacking shots, whereas a middle-over spinner can focus on reducing the scoring rate. A death bowler faces batters who are usually trying to hit boundaries from almost every delivery. Their economy may therefore rise even when they execute their role successfully. Scorecards that provide over-by-over information can make these tactical differences easier to identify. Readers can see when wickets fell, how quickly runs were conceded, and which bowlers were operating during key phases. Bowling partnerships can also create pressure because one player may restrict scoring while another attacks. The captain can then keep the pressure going by adjusting field positions or changing the bowling combination. Looking at the complete sequence of spells can reveal more than simply identifying the bowler with the most wickets. A successful bowling strategy often depends on several players performing different tasks at the right moments. Scorecards provide the raw information needed to see those patterns.
Required Rate Changes Decisions
During a chase, the required scoring rate can influence almost every major decision made by the batting team. When the required rate is low, batters can usually rotate the strike and wait for safer scoring opportunities. As the required rate increases, boundaries become more valuable and risk-taking becomes more necessary. This pressure can also change how bowlers attack because they know batters may attempt higher-risk shots. Wickets remaining can strongly influence whether those risks are sensible. A team with eight wickets available may tolerate more aggressive batting than a side that has lost most of its top order. The current partnership matters as well because established batters may have a better understanding of conditions than newly arrived players. Scorecards and live score displays can often show the required runs and scoring rate together, allowing readers to follow this pressure without doing complicated calculations. The same target can look easy or almost impossible depending on the number of deliveries left. This is why simply saying that a team needs fifty runs does not provide enough information. Readers need to know how many overs remain, how many wickets are available, and how quickly the team has been scoring recently. The required rate becomes meaningful when all these factors are considered together.
All Rounders Add Variety
All-rounders can make scorecards more interesting because their contribution may appear across multiple sections. An all-rounder might score useful runs before later bowling several overs, giving the team additional flexibility in both innings. Their batting statistics should be considered together with their bowling figures rather than judged separately. A player scoring thirty-five runs and taking two wickets may have made a broader contribution than a specialist who produced a larger figure in only one discipline. The value of an all-rounder often comes from balance and adaptability rather than one outstanding statistic. A team may use an all-rounder differently depending on the match situation. They might bat higher during a difficult chase or bowl earlier if the main bowlers are struggling. This makes role interpretation especially important when reading their scorecard numbers. Fielding contributions can also add another layer because many all-rounders are selected partly for their athletic ability. One catch or important run-saving effort can complement their batting and bowling work. Scorecards allow fans to see these contributions spread across different sections. Looking at the complete performance can therefore provide a better understanding of why an all-rounder was valuable. Their numbers may not lead any single category, but the combined contribution can still influence the result significantly.
Wicketkeepers Bring Extra Value
Wicketkeepers often contribute in ways that extend beyond their batting score, and scorecards can capture some of those additional efforts. Catches taken behind the stumps and stumpings can directly lead to wickets, while other actions may not be reflected in simple numerical summaries. A good wicketkeeper can also support bowlers through positioning, communication, and quick reactions. When a batter edges the ball or steps outside the crease, the wicketkeeper is responsible for completing an opportunity that might otherwise be missed. Batting figures remain important because many modern wicketkeepers are expected to make significant contributions with the bat as well. A player who scores quickly while also taking several catches can provide substantial value to the team. Comparisons between wicketkeepers should therefore consider both batting and dismissal contributions rather than focusing on only one area. Different formats can also change expectations because T20 cricket often requires quick batting while Test cricket can place greater emphasis on sustained concentration behind the stumps. Scorecards provide useful information through catches, stumpings, and batting numbers. While they may not capture every aspect of wicketkeeping quality, they can still show important parts of the player’s overall contribution. This makes the role more interesting to evaluate than a simple batting ranking might suggest.
Fielding Errors Cost Runs
Fielding statistics can also reveal moments when a team lost control through dropped catches, missed run-outs, overthrows, or other mistakes. Some errors appear directly in match records, while others may only become obvious through watching the game. A dropped catch can be especially costly if the batter later scores a large number of runs. A missed run-out can extend a partnership and change the direction of an innings. Overthrows may give away additional runs when fielders attempt difficult returns under pressure. These moments are important because cricket margins can be extremely small. A team losing by three runs may look back at several avoidable fielding mistakes that contributed to the final difference. Scorecards may not always capture every error in a standardized numerical form, but the resulting runs and wickets can still provide clues. Strong fielding therefore involves more than taking spectacular catches. It also requires reliable communication, accurate throwing, quick movement, and good decision-making. The pressure of a close match can make those details even more important. Readers who study scorecards alongside match footage can sometimes identify where fielding quality influenced the result. This provides a more complete picture of team performance and explains why fielding is often called an important third discipline alongside batting and bowling.
Tournament Pressure Changes Matches
A match can have different importance depending on where it appears during a tournament, and that context can affect how players approach the game. Early group matches may provide opportunities to experiment, while later games can become critical for qualification. A team already ahead in points may take fewer risks than a side that needs a decisive victory. Net run rate can also become important when qualification depends on margins of victory. A team may need not only to win but to win by a particular margin to improve its standing. This can influence batting decisions during the final overs or bowling choices when defending a total. Scorecards preserve the match numbers that eventually contribute to these broader tournament situations. Runs scored, overs used, wickets lost, and margins of victory can all matter beyond the individual game. Readers following a tournament should therefore consider both the scorecard and the standings. A comfortable win can have value beyond the immediate two points or other competition reward because the scoring margin may help later. A narrow defeat can also be preferable to a heavy loss in some qualification scenarios. Exact consequences depend on tournament rules, so official competition information remains important when evaluating those situations.
Comparing Batters Requires Patience
Comparing batters fairly requires more than placing their highest scores beside one another. A player who regularly scores forty runs may provide greater consistency than someone who produces one century and several very small scores. Balls faced, strike rate, batting position, and match situations can all influence how those performances should be assessed. Opening batters can face tougher conditions, while middle-order players may have different opportunities to build an innings. Lower-order players may have fewer chances but can still make important late contributions. A player’s performance across several matches generally provides more information than one isolated scorecard. Readers can examine whether the player performs well against different bowling attacks or under different conditions. They can also notice whether scoring patterns change when the team bats first compared with chasing a target. None of these statistics alone provides a complete answer about player quality. However, together they create useful evidence. Scorecards are especially valuable for this because they provide standardized information that can be compared across matches. A patient approach helps avoid overreacting to one excellent or poor innings. In cricket, form can change quickly, and long-term consistency often tells a more useful story than one memorable score.
Comparing Bowlers Takes Similar Care
Bowler comparisons also require attention to role, workload, match stage, and opposition quality. A bowler taking twenty wickets across several matches may appear stronger than another who takes fewer, but economy and conditions can change that impression. One player may be responsible for attacking during the powerplay, while another is used to contain scoring during the middle overs. A death bowler may concede more because their assignments are particularly difficult. A spinner operating on a turning pitch can produce different numbers from one bowling on a flat surface. Scorecards allow readers to compare wickets, overs, runs conceded, economy, and maidens over a series of matches. This can reveal whether a bowler consistently controls the scoring rate or regularly creates breakthroughs. It can also show whether performances change when the player is used in different phases. The most useful comparison usually focuses on whether each bowler fulfilled their assigned role effectively. A player does not need to lead every statistical category to be valuable. Teams often succeed because different bowlers contribute in complementary ways. Scorecards provide evidence of those contributions, but readers need to understand how the bowling attack was constructed before reaching conclusions. That makes comparisons fairer and more useful.
Historical Records Add Perspective
A completed scorecard can provide valuable perspective because it allows fans to revisit matches without relying solely on memory. People often remember a huge innings or dramatic final over while forgetting the smaller contributions that made the result possible. Detailed records preserve batting figures, bowling figures, partnerships, extras, and wicket timings long after the crowd has gone home. Historical comparisons can also reveal how cricket has changed. Scoring rates have increased in many competitions, while players have become more specialized across formats. Teams now use different bowling combinations and batting roles depending on the conditions. Comparing records from different periods can show those changes through actual numbers. Such comparisons require caution because pitches, rules, equipment, and competition structures can differ. Still, scorecards provide a valuable starting point for understanding how the game developed. Researchers can use them for statistical studies, while fans can use them to revisit memorable matches. A good scorecard therefore has lasting value beyond the day it was created. It becomes a small part of cricket’s larger historical record. The numbers remain available for anyone who wants to understand what happened and how individual performances contributed to the final result.
Beginners Can Take It Slowly
A detailed cricket scorecard may seem crowded to a new fan, but there is no need to understand every section immediately. The simplest starting points are team total, wickets, overs, individual runs, and bowling wickets. Those figures already reveal the basic direction of an innings. Balls faced and strike rate can then help explain batting speed, while economy and overs help explain bowling control. Partnerships and fall of wickets provide information about team progress, while extras explain parts of the score that do not belong to individual batters. During a chase, required runs and remaining deliveries become especially useful. Learning these sections gradually makes the overall page much easier to read. Watching a match while checking the scorecard can also help because the numbers become connected with actual events. A wicket falling after a large partnership suddenly makes partnership statistics easier to understand. A rapidly increasing required rate explains why batters begin attacking more aggressively. These connections make the scorecard feel less like a collection of random numbers. Advanced statistics can always be added later when the basics become familiar. The goal is simply to understand the match better and appreciate how different contributions combine. Cricket becomes much more enjoyable when its numbers start making sense.
Conclusion
Cricket scorecards provide a detailed way to understand how matches develop through different phases rather than simply showing who won at the end. Team totals establish the basic position, while wickets and overs reveal how much stability or pressure exists. Batting position, runs, balls faced, strike rate, and boundary counts explain how players approach different responsibilities. Bowling workload, wickets, economy, and maidens reveal how bowlers contribute during specific stages of an innings. Partnerships show how players build the score together, while dismissals and fall-of-wickets information reveal important turning points. Extras can expose problems with bowling discipline, while required scoring rates show how pressure changes during a chase. All-rounders and wicketkeepers can influence several areas of the game, while fielding quality can quietly decide close matches through catches, run-outs, saved runs, and reduced scoring opportunities. Tournament context can change the importance of individual results, especially when qualification and net run rate become important. Comparing several scorecards provides better insight into form and consistency than judging one match alone. Historical records preserve these performances for future discussion and analysis. Beginners can learn everything gradually without feeling overwhelmed. Continue exploring reliable cricket scorecards, player statistics, team performances, and detailed match records to develop a clearer view of the game and the numbers that shape every result.
Read also :-
india pakistan head to head in cricket
south africa national cricket team vs india national cricket team stats